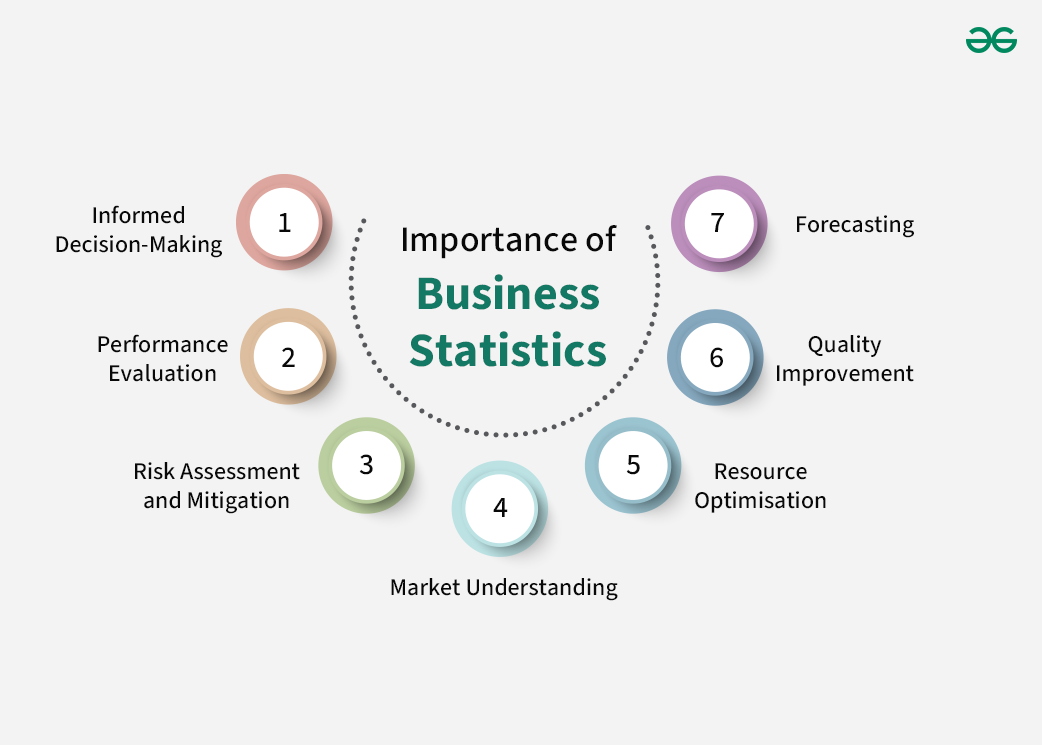
Every business runs on numbers whether it’s tracking sales, checking how a campaign is doing, or planning for next quarter. That’s where business statistics comes in. It’s basically the way companies use data to figure out what’s working, what’s not, and what to do next. Instead of guessing, business stats helps you look at the actual numbers and make smart decisions. From marketing to finance, it helps break things down and keeps you moving in the right direction.
Why It Actually Matters
Let’s be real guessing doesn’t work in business. You can’t just hope your new product will sell or that your marketing campaign will take off. You need proof. Business statistics helps you see the bigger picture. It shows real results backed by numbers, so you’re not flying blind. Whether it’s a spike in sales or a drop in website traffic, it tells you why it happened and what to do next.
How It’s Used in Everyday Business
Marketing that actually works
Ever wonder which ad brought in the most customers? Or what time of day your audience is most active? Business stats break all that down, so you don’t waste money on what doesn’t work.
Smarter financial planning
Businesses use stats to track profits, plan budgets, and avoid overspending. It helps with predicting future earnings and preparing for slow months before they hit.
Fixing supply chain headaches
Too much stock? Running out too fast? Business statistics shows you patterns in inventory and helps you manage what to buy, when, and how much.
Understanding your customers
Stats help you know who your customers are, what they want, and what’s turning them away. With that insight, you can improve your service and keep them coming back.
Basic Stuff You’ll See in Business Statistics
Descriptive stats
This is where you get summaries like average monthly sales, total users, conversion rates. It’s the first step to seeing what’s going on.
Inferential stats
Let’s say you ask 100 customers for feedback this type of stat helps you guess what all your customers probably think, not just those 100.
Probability
It’s used when businesses want to know the chances of something happening, like whether a product launch will succeed or flop.
Why It Makes Business Smarter
Without business statistics, you’re just hoping things go well. With it, you’ve got a clear view of what’s working and what’s not. You can stop wasting time and money on bad ideas and start focusing on what actually brings results. It helps with planning, decision-making, and getting better every step of the way.
Tools That Help Do the Job
Excel: Still super popular for basic stats and charts
Google Analytics: A must for checking website performance
Power BI / Tableau: Great for visualizing data in dashboards
Python or R: If you’re doing deeper data analysis or predictions
Frequently Asked Questions (FAQs)
What’s business statistics, really?
It’s basically how businesses use numbers to understand what’s going on. Instead of guessing, they look at actual data to figure out what’s working, what needs fixing, and where to go next.
How do companies actually use it?
Lots of ways. They check which ads bring in the most sales, spot what products are selling fast, figure out what customers like, and even plan for the slow months. It’s useful in almost every part of a business.
What’s the deal with descriptive vs inferential stats?
Descriptive stats just show you what’s already happened like your average monthly sales. Inferential stats help you take a small set of data (like a customer survey) and make smart guesses about the bigger picture.
Why does this stuff even matter?
Because guessing gets expensive. Business stats helps you make decisions that are backed by facts. That means fewer mistakes and better results.
Is this only for big companies?
Not at all. Small businesses can totally use this too. Even basic tools like Excel or Google Analytics can give you solid insights without needing a fancy setup.
What tools do people use for this?
Some stick with Excel. Others go with Power BI, Tableau, or Google Analytics for visuals and trends. If you’re more into deep data work, tools like Python or R come in handy but you don’t have to start there.
Can this really improve how a business runs?
For sure. Once you understand your numbers, you stop making blind choices. You get better at marketing, planning, budgeting you name it. Everything just gets sharper.
Conclusion
Business statistics helps you stop guessing and start making better calls. It shows you what the numbers really mean so you can understand what’s working and what’s not. Whether it’s boosting sales, fixing problems, or planning ahead, stats give you the kind of clarity that makes a real difference. Doesn’t matter if you’re running a small shop or a big company knowing how to read your data puts you in control and helps you grow the smart way.

